Five trading methods, tested over five years of market
Five well-known patterns, measured over five years of data, to see which give a real edge and where it disappears.
The context
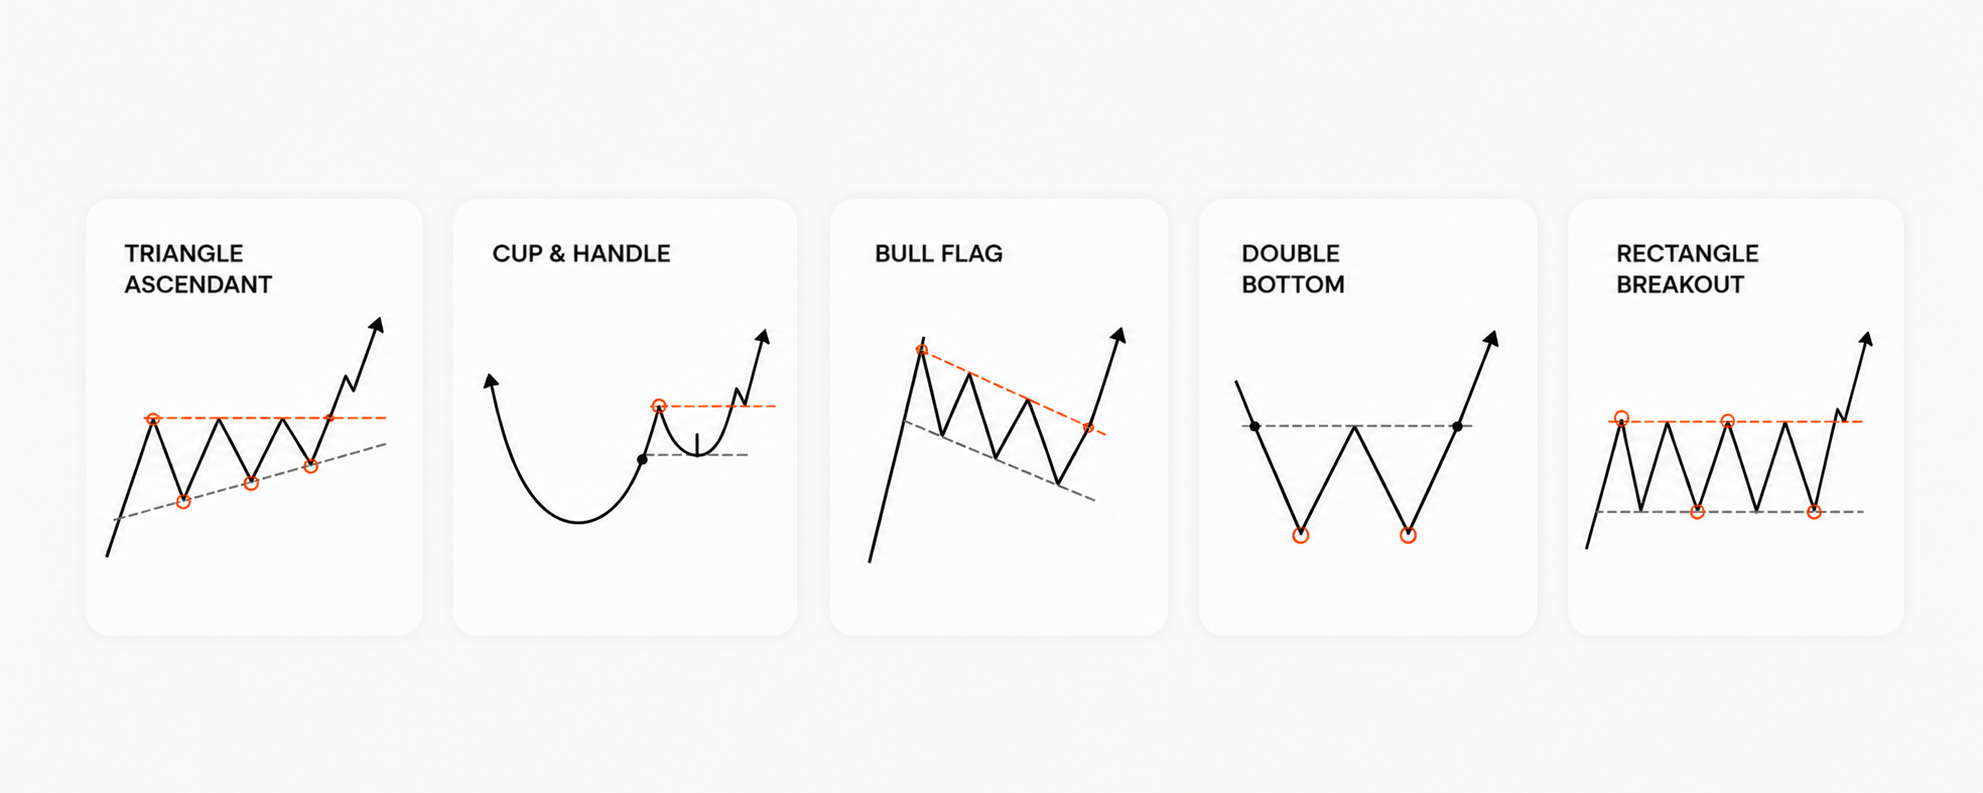
Peter Brandt is a trader known for his chart patterns, those price drawings meant to signal a move, like the ascending triangle, the cup and handle or the bull flag. They're taught everywhere, but one question is rarely settled: which actually give a statistical edge, and which are mostly belief. This project answers by measurement, with an engine that tests each pattern on the same data rather than trusting the eye.
Over 50 large US companies and five years of market, the program reviewed more than a thousand trades. Overall, the strategy wins clearly more than it loses. One pattern clearly stands out, the ascending triangle, reliable because tested on a very large number of cases. Another, the cup and handle, posts an impressive score but on too few cases to be trusted, and I say so. A third, the bull flag, disappoints even after improvement.
But the most important finding is elsewhere. The same strategy loses money in 2021 and 2022, then wins from 2023 to 2026. Its effectiveness therefore depends on the state of the market. This is neither investment advice nor a promise of gain.
The problem
Testing a trading pattern properly is harder than it looks. It's easy to produce a flattering backtest without meaning to, by adjusting after the fact or relying on a few nice cases. Without a fixed method, you quickly confuse luck with a durable edge, and a brilliant result on ten trades with a real rule. What's almost always missing is a clear hierarchy between the patterns and a validation that also says when the strategy fails.
How it works
A reproducible test engine that detects five patterns and evaluates them all on the same 50 large US stocks, from 2021 to 2026. Reproducible means that re-running the program lands on exactly the same results, with no manual tweak that would embellish the verdict. Each rule is fixed and written in advance, to measure the real edge of each pattern, not to tell a nice story after the fact.
The program spots each pattern then simulates a buy only if the price truly crosses the planned threshold, never by guessing ahead. On each position, the possible loss is capped at a small share of capital, and the trade is only attempted if the market is calm and rather bullish, to avoid choppy periods. Whenever a doubt exists, I keep the least favorable scenario, to never embellish the result.
The limits, owned
- Brokerage fees and slippage (the gap between the target price and the price actually obtained) are not modeled.
- There's a survivorship bias: the 50 stocks tested still exist today.
- The period doesn't contain a real panic crash, so behavior in extreme conditions isn't covered.
- I prefer to state these limits rather than hide them.
What it proves
When a result shines but rests on too few cases to be reliable, I flag it instead of passing it off as an edge. It's the same rigor I apply for a client: measure what actually works, and say clearly when it stops working.
This post is neither investment advice nor a recommendation. For any decision, consult a registered financial investment advisor. Past performance does not guarantee future performance and any investment carries a risk of capital loss.